+
We are excited to announce Grafana Labs is to acquire Kausal. Read more
twitter icon

Blog

Kausal to join Grafana Labs to bring Prometheus to the masses

Twitter profile image
on Mar 10, 2018

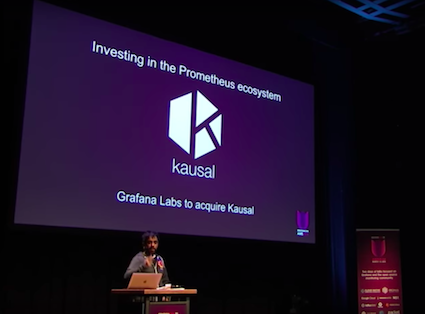
GrafanaCon announcement on stage

We are excited to announce Grafana Labs has entered into a definitive agreement to acquire Kausal (Conference video of the announcement). Today we got a bit closer to fulfilling Kausal’s mission: To help developers better understand how their code behaves in production.

Cortex Issue During FOSDEM 2018

Twitter profile image
on Feb 12, 2018

This year Kausal hosted FOSDEM’s Prometheus data on our dev instance. Sure enough, there was an issue that we discuss in this blog post. Kausal’s backend timeseries store runs on Cortex, a multitenant, horizontally scalable Prometheus. Hence this post-mortem is also a good resource on operating Cortex.

Summary

After the link to the FOSDEM Prometheus dashboard was tweeted, queries from the dashboard’s proxy took more than 10 seconds or returned with an error.

Tweets to FOSDEM dashboard

QPS to FOSDEM dashboard

Prometheus at FOSDEM 2018

Twitter profile image
on Feb 4, 2018

We’ve just come back from a great weekend at FOSDEM, the annual conference for all things Open Source. There were some great Prometheus-related talks:

This year all this monitoring data was stored in Kausal. We were happy to put the latest release of Cortex to use and see how it would behave under load.

FOSDEM 2018 Dashboard with metrics hosted by Kausal

OpenCensus with Prometheus and Kubernetes

Twitter profile image
on Jan 18, 2018

Yesterday, Google announced OpenCensus, an instrumentation framework for monitoring and tracing. It comes with a set of client libraries for Golang and Java, with more to come. More importantly, it introduces a set of abstractions (records, views, exporters) that could shape how apps will be instrumented.

Today we’ve been kicking the tyres by building their example Go app and connecting it to a local Prometheus.

Developing Grafana Dashboards with Jsonnet

Twitter profile image
on Jan 17, 2018

We are currently developing KLUMPS, a set of preconfigured Kubernetes dashboards for Grafana. To define these dashboards we are using Jsonnet, a JSON templating language. This allows us to define panel templates that we can compose and parameterize, like g.queryPanel('up{job="node-exporter"}') which outputs tens of lines of JSON for a time-series chart (we’ll write another blog post about why and how we are using Jsonnet). These templates are ideal for large repetitive configurations like Grafana dashboards. This blog post describes the development setup we use to achieve a short feedback loop while working on the dashboards.