Cortex Issue During FOSDEM 2018
This year Kausal hosted FOSDEM’s Prometheus data on our dev instance. Sure enough, there was an issue that we discuss in this blog post. Kausal’s backend timeseries store runs on Cortex, a multitenant, horizontally scalable Prometheus. Hence this post-mortem is also a good resource on operating Cortex.
Summary
After the link to the FOSDEM Prometheus dashboard was tweeted, queries from the dashboard’s proxy took more than 10 seconds or returned with an error.
Impact
Over the course of an hour ca. 2500 queries (33%) returned with an error [1] and ca. 2000 queries (27%) took longer than 10 seconds [2]. Total requests during that hour were 7500 [3]. The production instance was unaffected.
Root Causes
Repeated medium range queries (6h) hit an underprovisioned Querier service. Some Querier processes were OOM’ing. Furthermore, caches were ineffective because their timeout was too low (100ms).
Trigger
Increased load after the link to the FOSDEM dashboard was tweeted on Saturday afternoon (2018-02-03T14:40:00Z).
Resolution
- Increased Querier replicas from 3 to 4
- Doubled Querier memory quota to 600MB
- Increase Memcache timeout to 10s
Detection
The FOSDEM NOC informed us that some queries were taking long or producing errors (500s as seen by Grafana instrumentation [4]). Latency warnings started appearing in the Slack monitoring channel. Nobody was paged (by design–we don’t page for alerts on the dev instance).
Action Items
- Investigate better caching strategies to deal with “hugs of death” (Tom) [weaveworks/cortex#685]
- Investigate aggressive query-results caching (Tom) [See promcache]
- Track Grafana issue on step alignment (David) [grafana/grafana#9705]
- Roll out Brian’s Cortex memory fixes to production instance (Tom) [Various PRs in weaveworks/cortex]
- Add metric exposing number of chunks fetched (Tom) [weaveworks/cortex#700]
Lessons Learned
What went well:
- Editing the resource allocations with Ksonnet and applying the changes to the cluster.
- Cortex’ architecture (separate ingestion, query and caching microsevices) allowed us to scale up the read path relatively risk-free, without impacting the write path. As the query services are stateless and ephemeral, restarting them to increase their resources provisioning was also easy.
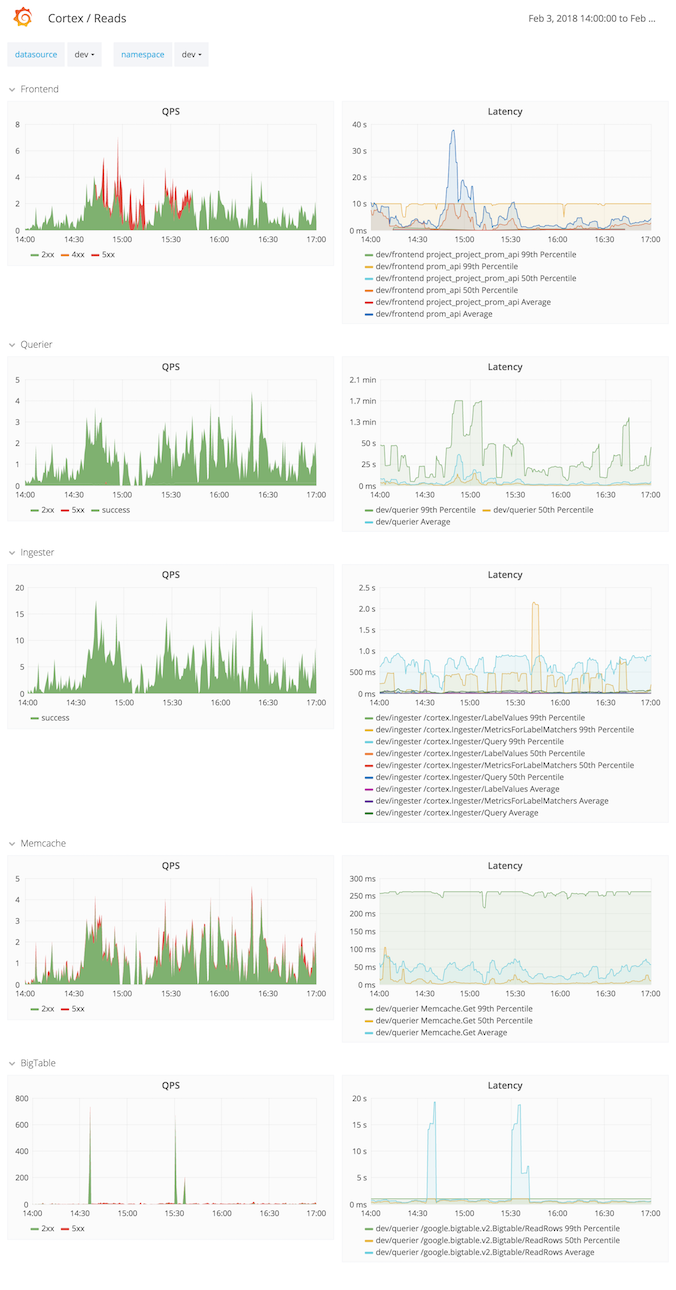
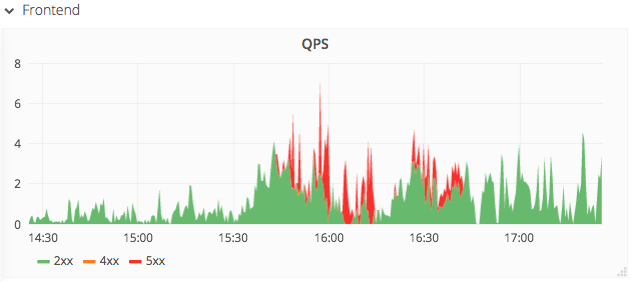
- “Cortex Reads” hierarchical dashboard showed all parts well [5]
What went wrong:
- The dev instance alerting is not configured to send out pages, all alert notifications just go to Slack, this is by design as we don’t want to wake the team up for non-paying customers. But perhaps we could consider alerting during working hours?
- The unallocated resources of the dev instance were not enough to bring the latencies down.
- The 99th percentile was difficult to determine since the top bucket was set to 10 seconds (see Frontend average latency piercing through the 99th percentile in [5]).
Where we got lucky:
- We still had unallocated node resources left on the cluster.
Timeline
2018-02-03 (all times UTC)
- 06:29 First samples received from FOSDEM.
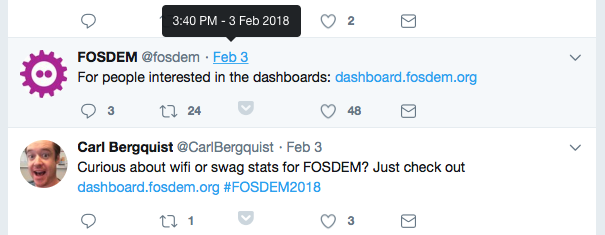
- 13:06 Carl Bergquist from Grafana tweets the dashboard URL.
- 14:38 Slack channel alerts on high latencies for the read path on the dev instance.
- 14:40 The FOSDEM account on Twitter tweeted the dashboard URL.
- 14:50 NOC reports seeing 500s and reaches out to Tom
- 14:59 Slack channel alerts on failing queries on dev instance.
- 15:21 Increased Querier replicas from 3 to 4 and doubled Querier memory quota
- 15:24 Slack channel receives alert resolution for failing queries.
- 19:33 Slack channel receives alert resolution for high latency queries.
Supporting Information
Some of these links need Kausal credentials.
Cortex Read Path
Dashboard in browser
  -> Grafana server
    -> Frontend (Edge)
      -> Querier -> Memcache
        -> Ingester
          -> Big Table
Logs
Querier logs were showing OOM exceptions.
Queries
[3] sum(request_duration_seconds_count{job=“dev/frontend”,route=“prom_api”,status_code=~“200|500”})
Dashboards
[5] Cortex Reads (needs login)