+
We are excited to announce Grafana Labs is to acquire Kausal. Read more
twitter icon

Blog

Videos from CloudNativeCon Austin

Twitter profile image
on Dec 19, 2017

I recently presented “The RED Method: How to Instrument Your Services” at CloudNativeCon Austin. The conference was a blast, and whilst my talk was beset by a couple of technical challenges I still think it went quite well! Here’s the video for those who couldn’t make it, and a full write up will be coming in the next few weeks:

Prometheus Tab-completion For Everybody

Twitter profile image
on Nov 22, 2017

I still remember my first steps with PromQL. Even after I learned more about the available functions and the Prometheus data model, the queries just would not flow as quickly as I liked. At Kausal, we believe making the writing of those queries easier will benefit the general adoption of Prometheus. That is why we decided to make our PromQL query editor open source.

Usage overview

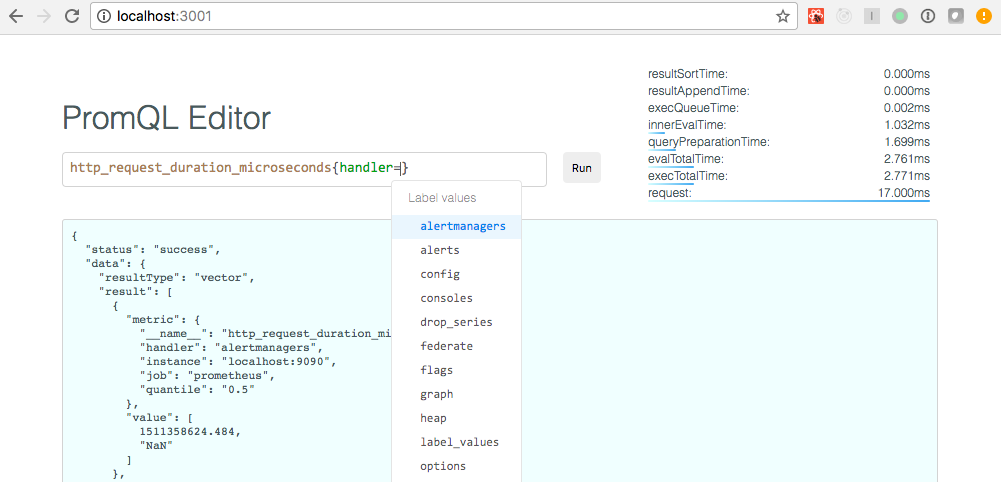
The editor comes with tab-completion for metric names, label keys, label values, ranges, etc. It is now available as prom-editor at our public mono-repo: https://github.com/kausalco/public, wrapped inside an example React application. We previously wrote about Slate and Prism, the underlying editor libraries. This blog post will dive a little deeper into the mechanics of the editor and its integration into an application.

The RED Method: How To Instrument Your Services

Twitter profile image
on Nov 17, 2017

I recently gave a preview of my CloudNativeCon 2017 talk at the London Go User Group and turns out they live streamed it! Here is the recording, skip to 57mins for my talk:

Prometheus Usage Charts–Or Who Has The Most Metrics

Twitter profile image
on Nov 6, 2017

Once developers have experienced the benefits of metrics instrumentation they go nuts and emit metrics for everything. That is a generally a good thing, but could also lead to unnecessary load on Prometheus or, depending on the label usage, extended query evaluation times. Sometimes it helps to see it to believe it. We recently added a usage graph for the metrics space to give our customers insight into their timeseries’ label space.

Usage overview

How To Get The Most Out Of Prometheus Histograms

Twitter profile image
on Nov 2, 2017
When using service level metrics, as suggested in the RED method, histograms play a central role. But even for a narrow time interval it is impractical to impossible to look at all latencies. Instead we can look at their distribution. A distribution becomes easier to reason about if it is ordered and partitioned into percentiles. Some percentiles are of particular interest. Looking at the 95th percentile gives you confidence in saying 95% of requests completed in a certain number of seconds.