Prometheus at FOSDEM 2018
We’ve just come back from a great weekend at FOSDEM, the annual conference for all things Open Source. There were some great Prometheus-related talks:
Our own Tom Wilkie gave his talk on the RED method (he even found two issues live that I have since fixed).
Brian Brazil talks about cloud native monitoring with Prometheus
Torkel Ödegaard presented some tricks and the upcoming features of Grafana 5.0
This year all this monitoring data was stored in Kausal. We were happy to put the latest release of Cortex to use and see how it would behave under load.
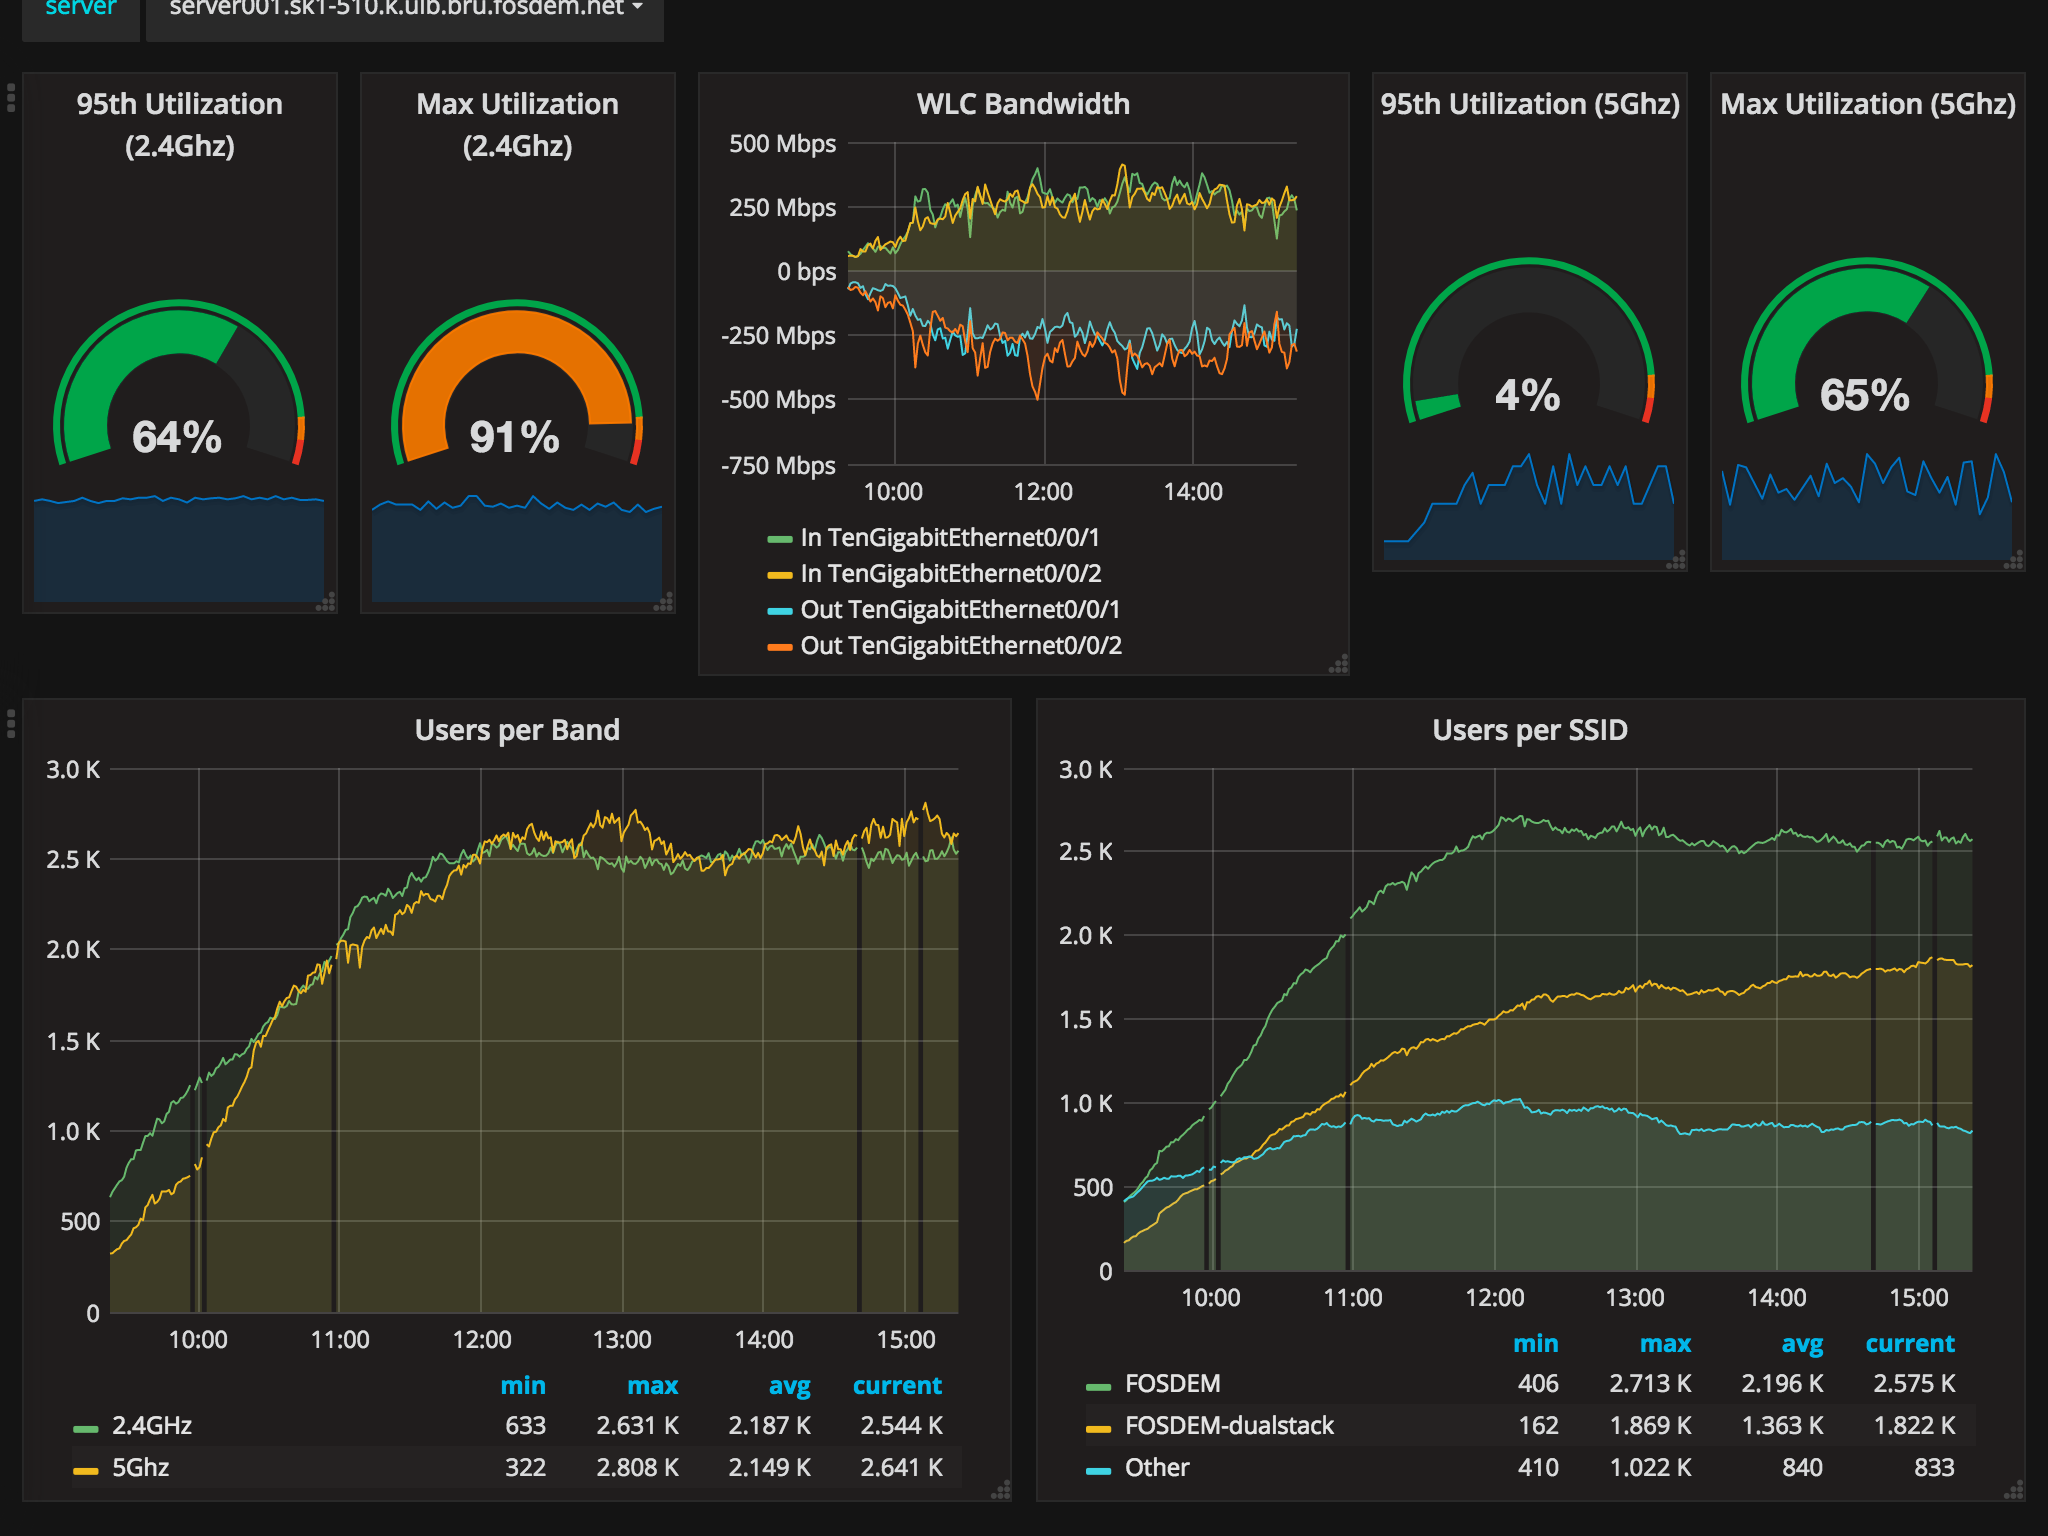
FOSDEM is a free and open conference, without registration, hosted by the Université libre de Bruxelles (ULB). Scores of volunteers make sure that chaos is kept in check and that the event can run smoothly. Monitoring the infrastructure on campus plays a vital part: the good folks operating the NOC set up lots of Prometheus exporters to track everything from WIFI statistics to T-shirt sizes still available.
After enabling the remote writing from the local Prometheus via one configuration line, data came streaming in at roughly 40,000 samples per second. A breakdown of the data shows what was generating all those timeseries:
900+ access points with unique names and MAC addresses, with the SNMP exporters producing 125K samples per scrape (query:
scrape_samples_scraped)90+ node exporters from webcams, laptops, and servers related to video streaming and encoding
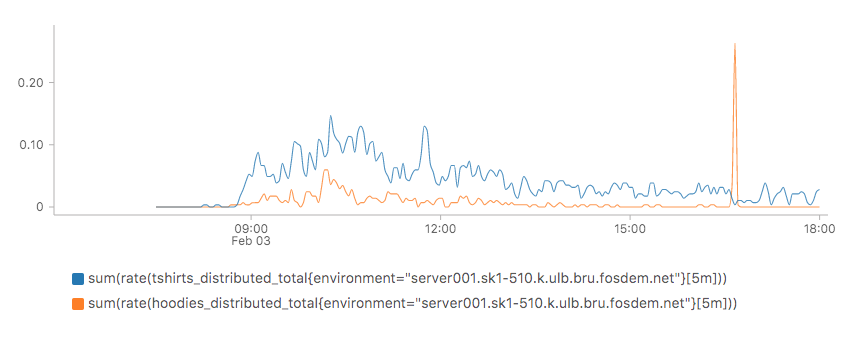
The swag desk!
I noticed quite the line at the t-shirt sales on Saturday morning. Thanks to monitoring we can see how busy it was. During one busy 5 minute period T-shirts were going at 0.15 pieces per second. And then someone must have bought a bulk of hoodies in the afternoon (orange line):
But there were also technical issues. At dawn that day, we set up the hosting of the monitoring data in our development environment, and sure enough, the sudden inflow of data caused an issue: The ingestor lantency shot up. The culprit was found rather quickly. Our dev cluster was provisioned at only a fraction of our production cluster’s CPU and memory limits, so we raised those limits and ingestion latencies went down again:
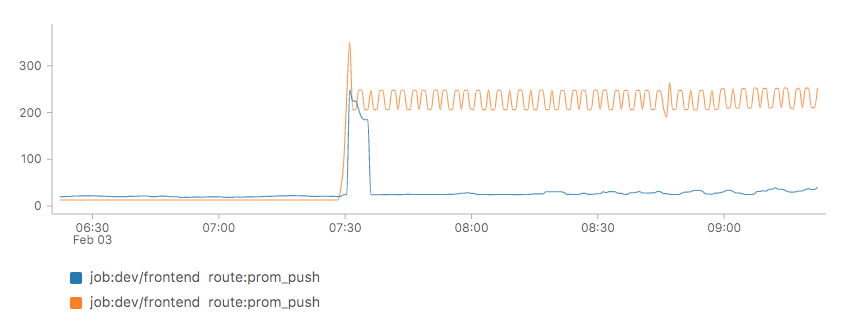
(Queries: job_route:request_duration_seconds:99quantile{job="dev/frontend",route="prom_push"} * 1e3 and sum(rate(request_duration_seconds_count{job="dev/frontend",route="prom_push"}[1m])) by (job, route))
A bigger issue came later in the day, that warrants its own post, as it explains a bit more about the inner workings of Cortex, the timeseries store that powers Kausal.