Cortex: Prometheus as a Service, One Year On
I recently gave a talk at PromCon 2017 in Munich about what we’ve learnt running Cortex, our open source horizontally scalable Prometheus implementation, for over a year. This blog post is a write up of that talk for those who couldn’t attend. There was a lot in the talk, so I’ve split the write up into three posts.
For those who can’t bear to wait, here the video:
Introduction
The story begins a year ago: I gave a talk at PromCon 2016 where I introduced “Project Frankenstein”, a horizontally scalable, distributed, multi-tenant Prometheus implementation. Since then lots has changed, not least the name! We now call it Cortex, and after a year of operations and improvements, it has become quite a sophisticated beast.
I started the talk at this year’s PromCon by asking the audience how many people came last year - it was not as many as I expected, perhaps a quarter of the audience. Therefore I spent some time covering the initial motivations for Cortex: we wanted to offer a hosted, Prometheus-as-a-Service after using Prometheus extensively for almost a year. Such a service needed things like native multi-tenancy with the same process; we had tried running multiple separate instances for users and discovered that didn’t scale operationally.
Cortex also needed to be horizontally scalable to cope with user growth, to be cost effective to run, and to offer durability and retention in-line with customer expectations for a SaaS product. Finally, the architecture we went with had some interesting opportunities - better query performance for lots of concurrent queries (i.e. when loading dashboards), or when doing long queries, by ‘vertically’ parallelising them. Want also wanted to follow all the latest trends: Microservices, Kubernetes, 12 factor, cattle not pets, CI/CD…
What resulted was the addition of the generic write path to Prometheus, then a custom implementation of Prometheus that used consistent hashing, virtual nodes and Dynamo-style replication to distribute writes. It used the same chunk compression format and query engine as Prometheus.
A Year’s Evolution
I split this section of the talk up into a series of problems and solutions, in a rough chronological order.
Problem #1: DynamoDB Write Throughput
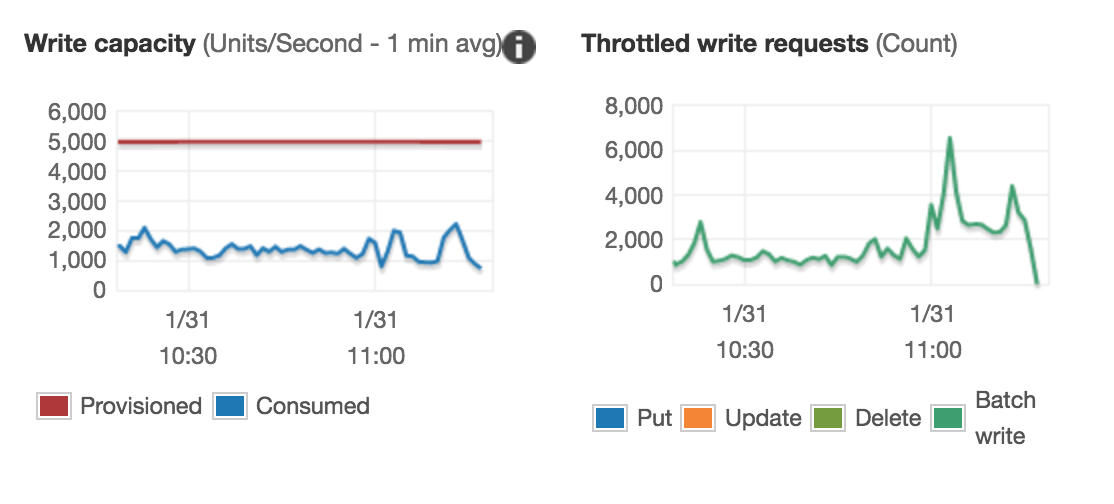
The initial version of Cortex had problems saturating the write throughput on DynamoDB - the symptom was the chunks were not being flushed as quickly as they were being created. Some background on DynamoDB: you pay for provisioned capacity, not used. If you try to use more than provisioned, you get throttled. We found with Cortex we were able to use ~10% of provisioned throughput before being throttled. This made Cortex very expensive to run.
This is a common problem people encounter with DynamoDB, and we found many examples of others blogging about this. We understood the problem is that DynamoDB splits tables up into partitions of about 10GB each. As a table gets bigger, more partitions are created. Each partition gets 1/Nth of your table’s provisioned throughput - as your table grows, per-partition throughput decreases. This is fine if your write distribution is perfectly uniformly distributed, but in practice this is very hard to achieve with timeseries-like workloads.
Our first attempt to fix this was to create a new table every new week. Write throughput per shard would now stay roughly constant, as within a given week the tables didn’t grow too big. This allows us to get much better usage of our provisioned throughput - by about 30% IIRC.
Problem #2: DynamoDB Write Throughput, again
30% is better than 10%, but it still meant Cortex was 3x more expensive to run than anticipated. We were still seeing throttling of writes long before we reached provisioned throughput, and we guessed that poor write-distribution between DynamoDB partitions was the cause. We added a histogram of write throughput per hash-bucket to measure this - it showed that writes were heavily skewed towards a small number of buckets.
Cortex writes an external memory, inverted index to DynamoDB. The initial schema was:
Hash Key:		<user ID>:<hour>:<metric name>
Range Key:		<label name>:<label value>:<chunk ID>
As some metrics in a typical Prometheus setup have many orders of magnitude more label/value combinations, our write key distribution was nowhere near perfectly distributed. Our solution was to move the label name into the hash key:
Hash Key:		<user ID>:<day>:<metric name>:<label name>
Range Key:		<chunk ID>:<chunk end time>
Around the same time we also moved to day-buckets in the hash key, put the label value into a separate, non-indexed field and put the chunk end time in the range key to optimise query performance. We also had to include a row with no label name, for queries that just involve metric name, and recently added a row with no metric name, so we can support queries with no metric name. During all this we build a schema migration mechanism to cope with all the iterations we did - we’re not on version 8!
The end result was achieving >90% utilisation of provisioned throughput - job done.
To be concluded
In the next blog post we will discuss how we handled “Queries of Death”, more DynamoDB issues, cost optimisation and eventually moved to Google Bigtable.